Run and debug your first App
Running apps
When you're ready to run the app, follow these steps for executing:
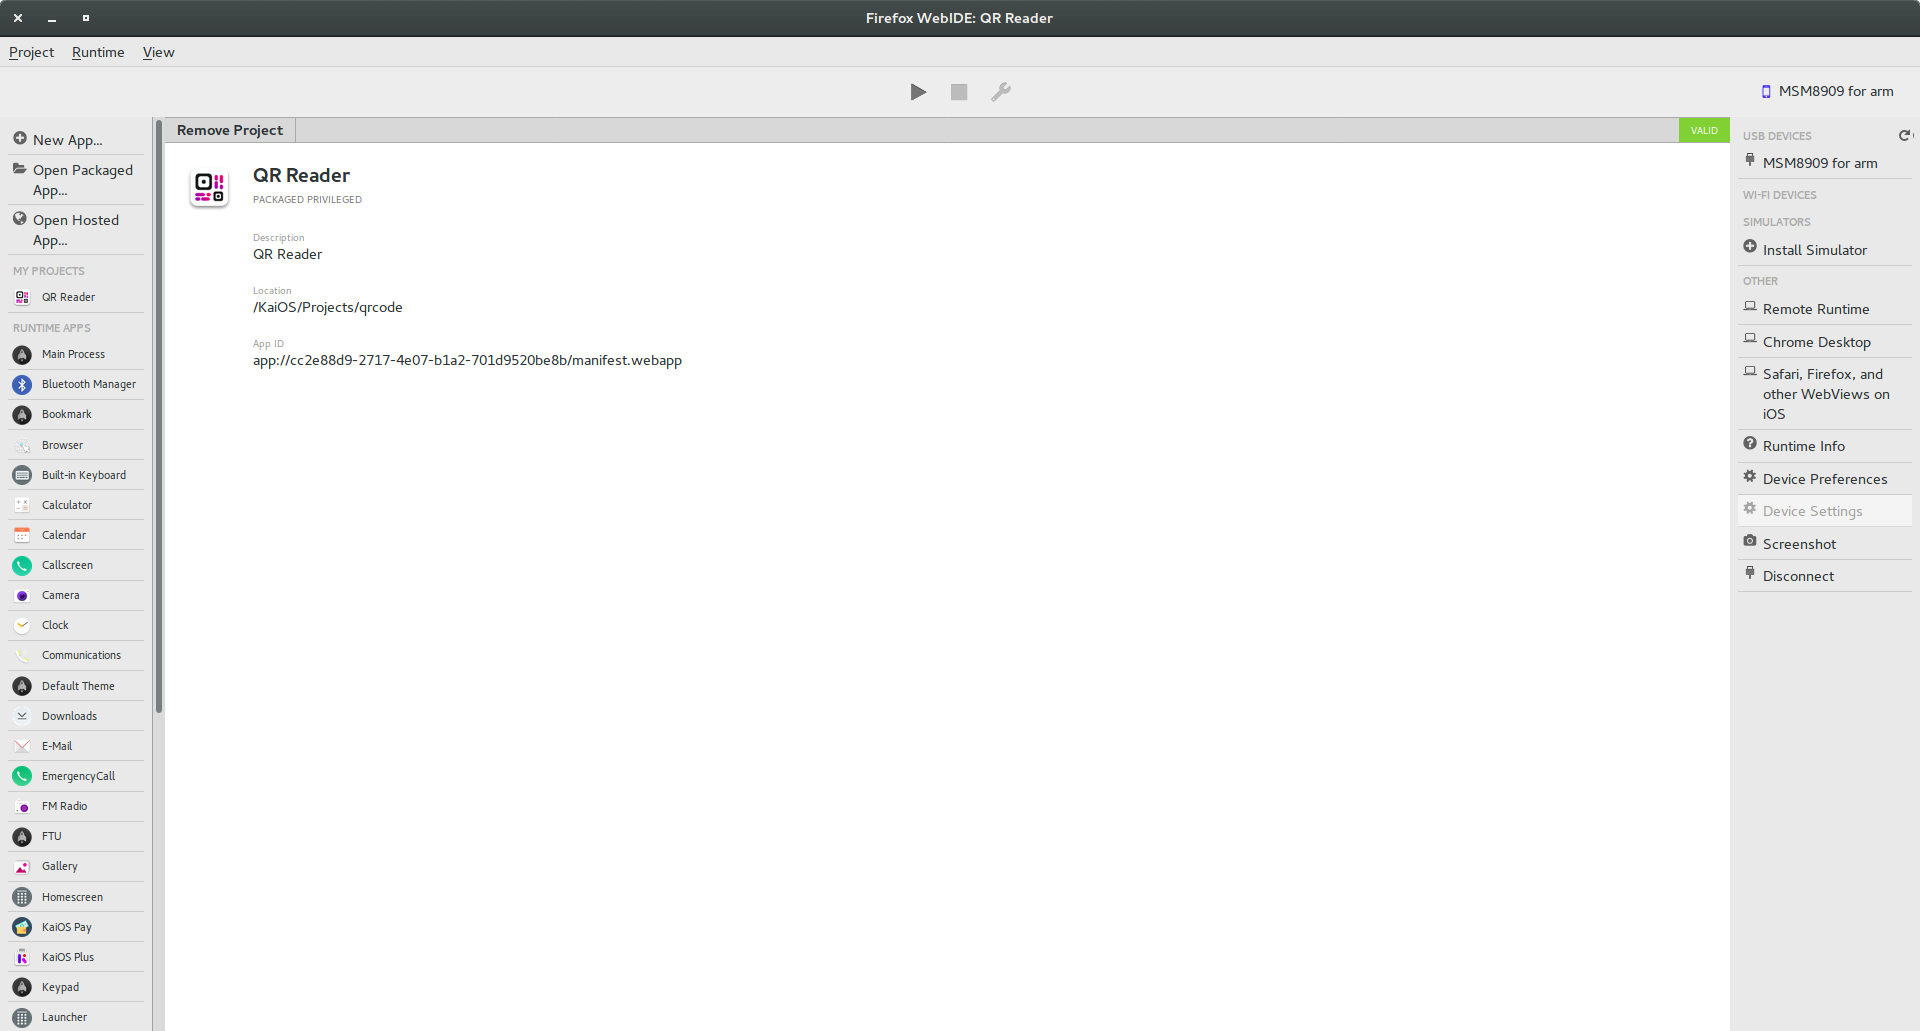
- Start WebIDE. If everything is fine until now, you can see your device on 'USB Devices' section.
- Click on the device name and all apps will be listed on the left side.
- Choose one app to run, inspect, debug, test, etc.
Debugging apps
To debug the app, click the wrench icon and the Developer Tools Toolbox appears, connected to your app:
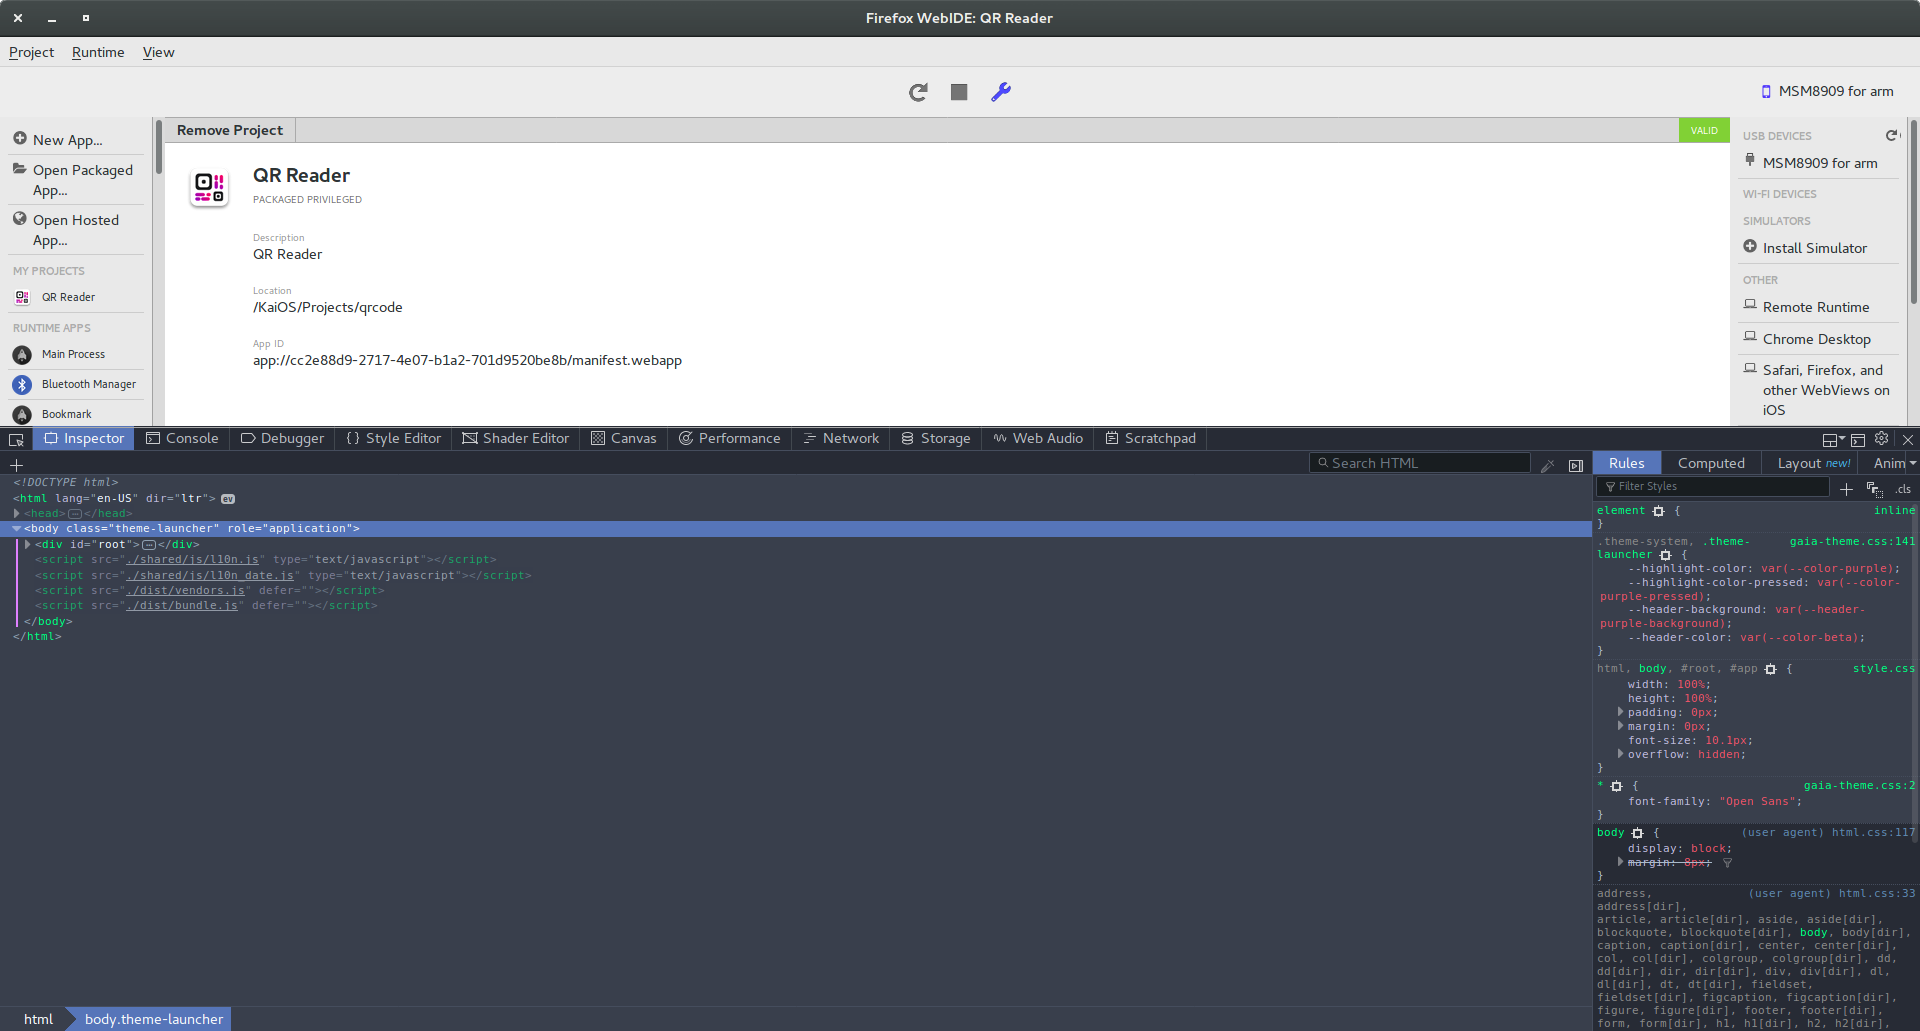
The basic tools available in your WebIDE are:
The Inspector to examine and modify the HTML and CSS of a page.
The Console for logs information associated with a web page and enables you to interact with a web page by executing JavaScript expressions in the context of the page.
The JavaScript Debugger enables you to step through JavaScript code and examine or modify its state to help track down bugs.
- Style Editor enables you to view and edit all the stylesheets associated with a page, create new stylesheets from scratch and import existing stylesheets and apply them.
The Scratchpad provides an environment for experimenting with JavaScript code. You can write, run, and examine the results of code that interacts with the web page.
Just as in a web page, any changes you make in the tools are visible immediately in the app, but are not persistent. Conversely, any changes you make in the editor pane can be saved straight back to disk, but are not visible without restarting the app.
Performance
If you're interested in the performance of your apps, there are a few ways to measure their impact on the runtime in WebIDE:
The Performance tool gives you insight into your app's general responsiveness, JavaScript and layout performance. With the Performance tool you create a recording, or profile, of your app over a period of time.
The Memory tool lets you take a snapshot of the current tab's memory heap. It then provides a number of views of the heap that can show you which objects account for memory usage and exactly where in your code you are allocating memory.
Generating memory reports with B2G
Another way to see the device's memory usage is creating a memory report with B2G tool. To create one follow the steps below:
Clone mozilla
git clone https://github.com/mozilla-b2g/B2G.gitApply this patch
cd B2G/tools
git apply path/to/memory.patch
Run the
get_about_memory.pyscript which will get information from the plugged device../get_about_memory.py -mA folder called
about-memory-0will be created intoB2G/toolsand inside then you will see a gzipped file.Open Firefox and type
"about:memory"into the address bar and hit Enter.
Click in "Load..." and open the gzipped created in step 3.
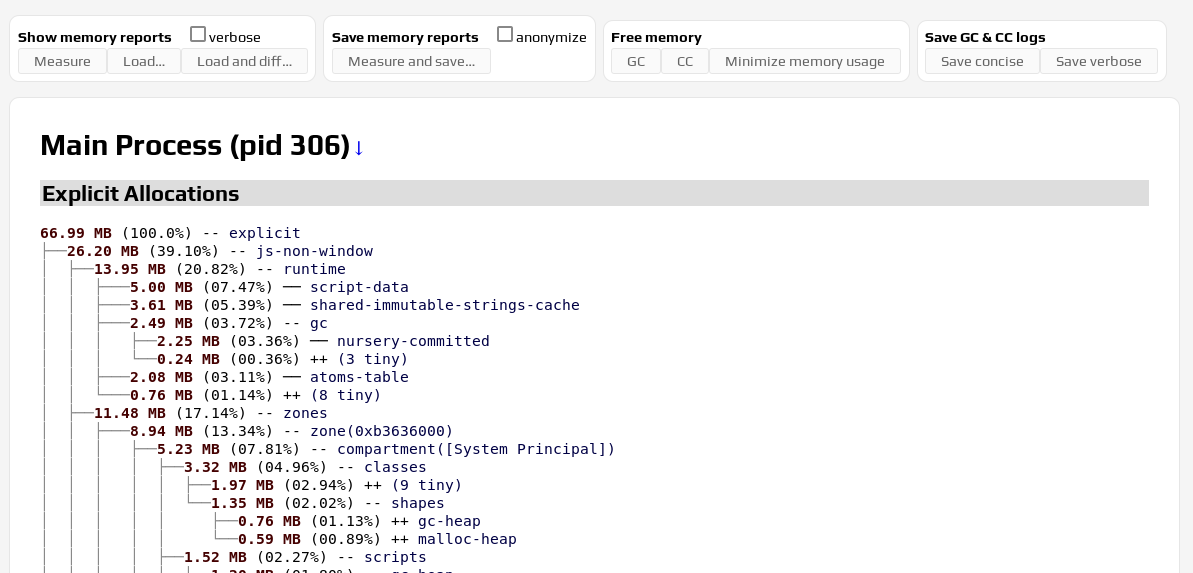
You can diff two different files too.